Sesame
Bringing clarity to payslips
Product
•
UX/UI
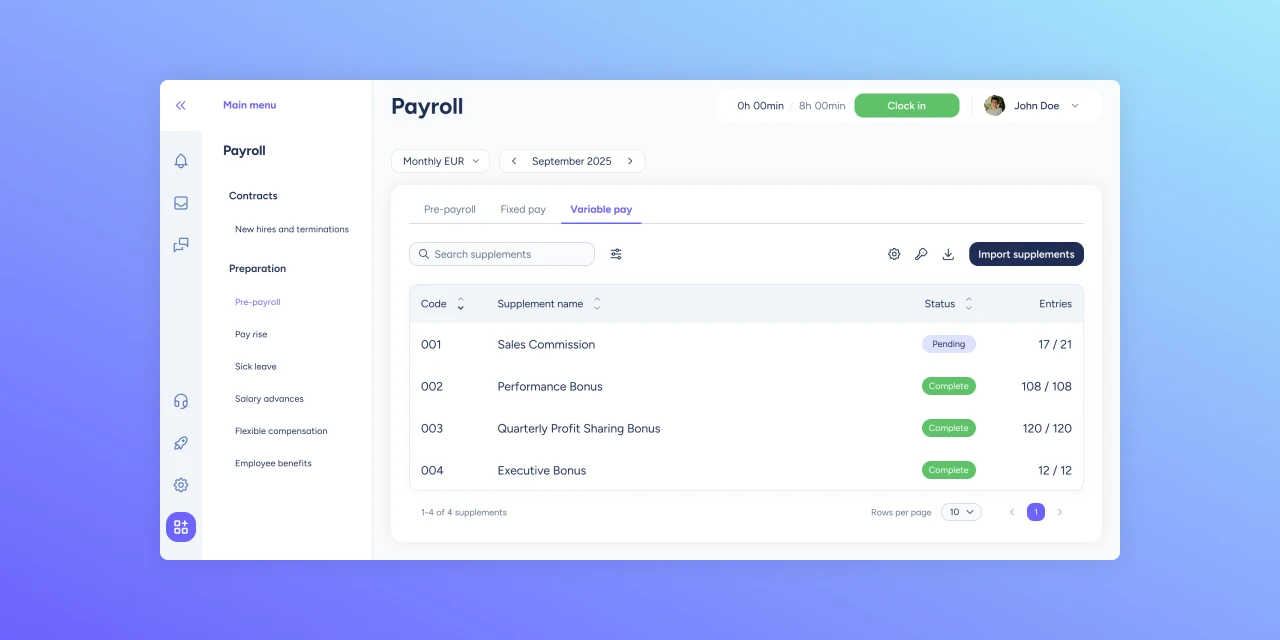
At Sesame, an all-in-one HRIS platform, the payroll module was designed for HR admins but overlooked the employee experience. As a product designer, I led the design of a new mobile payslip view that helps employees clearly see how their salary is broken down and evolves over time, reducing HR support requests and improving employee trust.
Problem
Most employees struggled to understand their payslips, leading to confusion, lower engagement, and frequent HR inquiries. Our goal was to make payslips clear, accessible, and transparent, especially for mobile users in frontline work environments.
Outcome
We launched a new payslip dashboard with breakdown charts, plain-language explanations, and pay history tracking. After rollout, several client HR teams reported a drop payslip-related support requests, and the feature became a selling point for commercials.

Dashboard, payslip breakdown and year summary
Unclear payslips hurt both employees and HR teams
It was a solid assumption that employees struggled to understand their payslips. Through interviews and a short employee survey, we confirmed that most people could not confidently explain what the items on their payslip meant, which amounts were added or deducted, or why their take-home pay varied month to month.
But this was not just a user experience issue. A key insight from our research was the broader business impact. HR teams were spending hours each month answering the same questions on pay, and the lack of clarity around compensation was quietly affecting employee engagement.
“I don't know what half of those terms mean. It always feels like I'm missing something.”
Employee, food manufacturing company
A mobile-first redesign for pay transparency
Most employees access Sesame through their mobile devices, often in work environments like factories, shops, or logistics centers. The new payslip experience was designed mobile-first to adapt to the needs and use context of the users.
We introduced a new dashboard showing a quick summary of the most recent payslip, a chart of the last six months, and year-to-date totals. Employees could dive deeper into details or explore their pay history with just a tap.
Payslip dashboard and year evolution
Simple UX patterns made complex data understandable
In the detail view, a color-coded pie chart helps break down each payslip into gross, earnings, and deductions. Each slice can be tapped to reveal the percentage and amount each item represents of the total monthly pay.
Payslips include legally required categories, acronyms, and deductions that most employees find hard to interpret. Each pay item in the breakdown list has a question mark icon. When tapped, a simple explanation opens in a drawer, written in plain language.
Pay items explanation drawer
More clarity for employees, less burden for HR
The solution gave employees more confidence in understanding their pay, helping them feel informed and in control. For HR teams, it reduced the burden of repetitive questions and more time to focus on strategic work.
Several client HR teams reported a noticeable drop in payslip-related support requests, and the redesigned experience became a selling point in commercial demos.
By improving a previously overlooked part of the platform, we helped HR teams work more efficiently and support employee trust.